1 Introduction
The living environment of plants is not always suitable, and often suffers from complex and variable adversities of various environmental factors such as high and low temperatures, freezing damage, light, moisture, nutrients, CO2, chemical elements, atmospheric pollution, herbicides and pesticides Coercion. The most intuitive response of plants to environmental stress is in morphology, but it often lags behind physiological responses. Once the damage has been caused, it is difficult to recover. By studying the physiological response of plants to environmental stress, it not only helps to reveal the physiological mechanism of plants adapting to adversity, but also helps to take practical and feasible technical measures in production to improve the resistance of plants or protect plants from harm. Favorable conditions for growth.
Since the 1980s, the emergence of portable photosynthesis measurement systems and phytoecological testing instruments such as chlorophyll fluorometers has provided new research methods for studying the stress physiology of plants and their responses, and has produced a large number of research results. But on the other hand, they all have their own limitations. When the phenomenon of uneven stomatal closure occurs, the Ci calculated by the blade gas exchange measurement system will be overestimated; in addition, the comparison of the leaf photosynthetic rate between different habitats has no direct meaning and is more time-consuming and laborious. Although chlorophyll fluorescence is easy to measure, if the experimental design is not good enough, the results will be difficult to interpret.

2 Observation system design
2.1 Objective
The chlorophyll fluorescence parameter is the first indicator that needs to be measured in the study of plant stress physiology. The chlorophyll fluorescence reaction is an indicator of plant photochemical reaction and is related to species, seasons, environment, sample conditions and other factors that affect plant physiological functions. Therefore, changes in chlorophyll fluorescence can be measured to reflect the plant's response to environmental stress.
Environmental factors such as precipitation, light, air temperature, and soil moisture in plant growth areas are closely related to the level of plant stress physiological stress. Real-time observation of them can help accurately reflect the dynamic impact of changes in environmental factors on plant stress physiological conditions.
Simultaneous measurement of live leaf gas exchange and chlorophyll fluorescence on the response of plants to environmental factors stress stress, combined with the simultaneous measurement of environmental factors can provide more meaningful results.
The AZ-B0300 Plant Stress Physiology Observation System can simultaneously measure plant gas exchange parameters, fluorescence parameters and environmental factors, and can be used for stress stress studies on various types of plant environmental factors.
2.2 Types of plant stress and measurement methods of fluorescence parameters
Type of coercion
Research methods and measurement parameters
Water stress
Measure gas exchange parameters such as net photosynthetic rate, stomatal conductance and water use efficiency;
Measuring Yield before and after heat treatment (39 ℃); C4 plant measuring ETR / A;
C3, C4 and CAM plants with moderate water stress, measuring Fs / Fo & Fo;
Parameters of OJIP curve and K-Step fluorescence kinetic curve.
Light stress
Measure gas exchange parameters such as net photosynthetic rate, stomatal conductance and water use efficiency;
Fluorescence quenching and quenching relaxation measurement-the best method to study the change of thylakoid membrane ⊿ph under light protection mechanism; OJIP parameters are more sensitive to light stress than Fv / Fm (Thach 2007).
High temperature stress
Measure gas exchange parameters such as net photosynthetic rate, stomatal conductance and water use efficiency;
Fluorescence quenching and quenching relaxation measurement --- suitable for studying moderate high temperature stress (≥35 ℃);
Light response curve Fv / Fm, Yield, OJIP parameters
(Dascaliuc A., Ralea t., Cuza P., 2007) (Schreiber U. 2004) (Strasser 2004)
Low temperature stress
Measure gas exchange parameters such as net photosynthetic rate, stomatal conductance and water use efficiency;
ETR / CO2 assimilation rate; Yield; Fv / Fm; ETR; fluorescence quenching and relaxation parameters (NPQ, qN, qP, qL, qE, qT, qI, Y (NPQ), Y (NO)), light response curve
(Cavender-Bares J., Bazzaz F., 2004) (Krause 1994) (Adams1994, 1995)
Frost damage stress
Yield; Fv / Fm; ETR; fluorescence quenching and relaxation parameters (NPQ, qN, qP, qL, qE, qT, qI, Y (NPQ), Y (NO).) (Ball 1994, 1995), (Krause 1994), (Adams1994, 1995)
CO2 stress
Measure gas exchange parameters such as net photosynthetic rate, stomatal conductance and water use efficiency;
FV / Fm, OJIP parameters are very sensitive to CO2 stress;
qP can well reflect the combined stress of water, light and CO2;
Yield and NPQ parameters are not sensitive to CO2 stress (Siffel & Braunova 1999).
Air pollution (O3)
Coercion
Yield, Fv / Fm, qP, NPQ and other parameters are very sensitive to O3 stress
(Calatayud, Pomares, Barreno 2006)
herbicide
Coercion
VJ-OJIP is sensitive to various pesticide stresses; Yield & NPQ; NPQ is sensitive to DDT and DCMU stresses. (Christiansen, Teicher and Streibig 2003) (Percival 2005)
chemical element
Coercion
Aluminum, cadmium, cobalt, copper, zinc, nickel, etc ...
nutrient
Coercion
Nitrogen, sulfur, boron, calcium, chlorine, iron, etc ...
2.3 Observation content
Fluorescence index: FRFexd360 / FRFecx440 (mainly used to measure nitrogen stress. This is an important measurement method to distinguish nitrogen stress from sulfur stress)
Kramer Lake model fluorescence quenching parameters: Y (II), qL, Y (NPQ), Y (NO)
Kughammer simplified Lake model fluorescence quenching parameters: Y (II), Y (NPQ), Y (NO), NPQ
Puddle model fluorescence quenching parameters: qP, qN, NPQ, qE (non-photochemical quenching caused by the photoprotection mechanism), qT (non-photochemical quenching caused by the steady-state transition process), qI (non-photochemical quenching caused by the steady state transition process) (Photochemical quenching)
Other conventional fluorescence parameters: Y, Fv / Fm, ETR, PAR, leaf temperature, Fo, Fm, Fv, Ft, Fod, Fms, Fs, OJIP curve
Photosynthesis parameters: photosynthesis rate, transpiration rate, stomatal conductance, etc.
Environmental parameters: temperature and humidity, radiation, soil moisture temperature, soil elements
2.4 System composition and technical indicators
AZ-B0300 plant stress physiological observation system can measure and store photosynthesis, fluorescence and environmental factor parameters.
Photosynthesis measurement unit:
Measuring range: CO2 0-3000ppm, resolution 1ppm, H2O 0-75 mbar, resolution 0.1mbar,
PAR 0-3000μmol m-2 s-1, cosine correction;
Controllable conditions: CO2 control up to 2000ppm; H2O control can be higher or lower than environmental conditions; temperature is controlled by micro peltier elements, which can be 10 ℃ higher or lower than the environment; PAR control is controlled by high-efficiency, low-heat red / blue LED array unit , Up to 2000μmol m-2 s-1;
Chlorophyll fluorescence measurement unit:
Measurement modes: Fv / Fm, Yield conventional measurement mode, Lake and Puddle model fluorescence quenching measurement mode, Kinetic fluorescence dynamics measurement mode, OJIP measurement mode, multiple saturation light flash measurement mode.
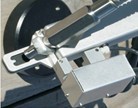
Multifunctional PAR leaf clip: Normally, if the plant is under nitrogen stress, the plant epidermis will accumulate a substance that has a strong ability to absorb ultraviolet light. The ratio of the infrared fluorescence value excited by ultraviolet light and blue light to determine the level of nitrogen stress in plants.
 a Dual light source saturation pulse: 690nm halogen lamp and dual channel 660nm and 450nm adjustable LED.
 The maximum light intensity of halogen lamp is 0-15,000μmolm-2s-1, LED 0-4,500μmolm-2s-1.
Photochemical light: LED light source 0-3,000 μmolm-2s-1, halogen light source 0-6,000 μmolm-2s-1.
Far-infrared light source: 735nmLED (used to measure Fod), with adjustable intensity.
Data storage: 1Gb memory capacity, can store tens of thousands of sets of data, expandable SD card.
Environmental Factors:
Total radiation 0-2000 W · m-2, resolution 1 W · m-2; rainfall 0.005mm ~ 250mm, resolution 0.005mm;
Photosynthetically active radiation 0 ~ 500W · m-2, resolution 1 W · m-2, sampling frequency 6 times / min, sliding average value as the result;
Air temperature -30 ℃ ~ + 70 ℃, resolution 0.1 ℃, sampling frequency 6 times / min, sliding average value as the result;
Relative humidity of air 0-100%, resolution 1%, sampling frequency 6 times / min, sliding average value as the result;
Surface temperature -30 ℃ ~ + 50 ℃, resolution 0.1 ℃, sampling frequency 6 times / min, sliding average value as the result;
Soil temperature -30 ℃ ~ + 100 ℃, resolution 0.1 ℃, sampling frequency 6 times / min, sliding average value as the result;
Rain pattern
Data collector: There are 16 programmable, multi-function channels, each channel is freely programmable and expandable. The measurement range is 40mV to 25V, and each channel can be given a mathematical calculation.
Operating software: contains system setting software and data reporting software. The system setting software is used to set each channel and calculation formula of the system, numerical average method, data file naming method, WEB page setting, Ethernet port setting. The data reporting software provides sliding average, vector average and graded average.
Soil moisture: moisture 0-100%, accuracy ± 2%; temperature -15 ℃ ~ + 50 ℃, accuracy ± 0.2 ℃. The measuring tube length is 0.6m, 1m, 1.5m, 2m, 2.5m, 3m. Adopt handheld computer and Bluetooth wireless communication.
Soil element
3 Data processing
The gas exchange parameter and fluorescence parameter measurement results obtained by the AZ-B0300 plant stress physiological measurement system were used for correlation analysis or principal component analysis with measurement data of various environmental factors or artificial processing conditions. In order to analyze the influence mechanism and contribution rate of various environmental factors on plant stress.
4 Application case
4.1 New method for plant water stress / light drought stress measurement (John Burke 2010)
It has always been difficult to measure the water stress and mild drought stress of C3 and C4 plants with a fluorometer. As early as 2007, Professor John Burke of the Texas Plant Stress Research Laboratory in the United States took cotton as the research object and provided a new method. The modulated fluorometer of the United States OPTIC company was used to measure the leaf samples before and after heat treatment at 40 ° Dark adaptation parameter Fv / Fm '(△ F / Fm') or light adaptation parameter Yield measurement results, found that the measured value can reflect the plant water stress and mild drought stress.
In May 2010, Professor John Burke published new research results again, further verifying the feasibility and scientificity of this new method.
Burke pointed out in the article that both C3 and C4 plants can be measured simply and quickly by this method, and 200-300 plant leaf samples can be measured at one time. This method compares the measurement results of the unstressed control plant and the drought-stressed plant from the day after the irrigation stops, and continues for several days. The results of the study showed that within 24 hours after the irrigation was stopped, the measurement results well reflected the water stress status, which was also verified by other laboratories.
Golf Practice Gloves,Golf Gloves,Velcro Golf Glove,Breathable Golf Glove
Grand Dragon Sports Company Limited , https://www.golfyy.com